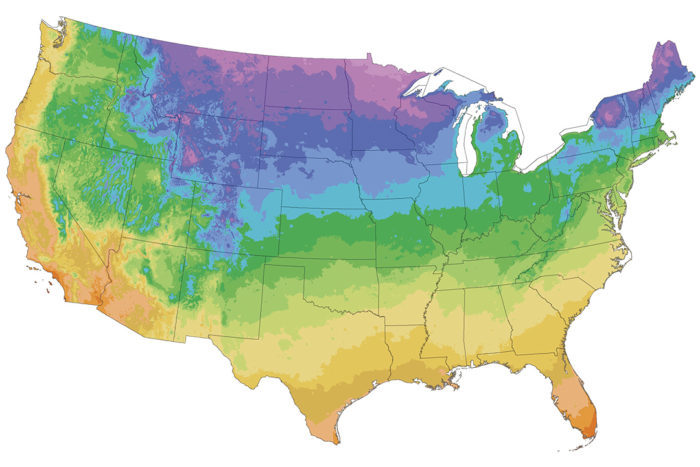
Ever since the first USDA (U.S. Department of Agriculture) Plant Hardiness Zone Map was created in 1965, this useful resource has been the first place gardeners go to figure out if a plant will thrive in their garden. Based on the average lowest winter temperatures across the country, it’s a measure that plant breeders, nursery owners, and gardeners rely on when developing, selling, or buying plants. 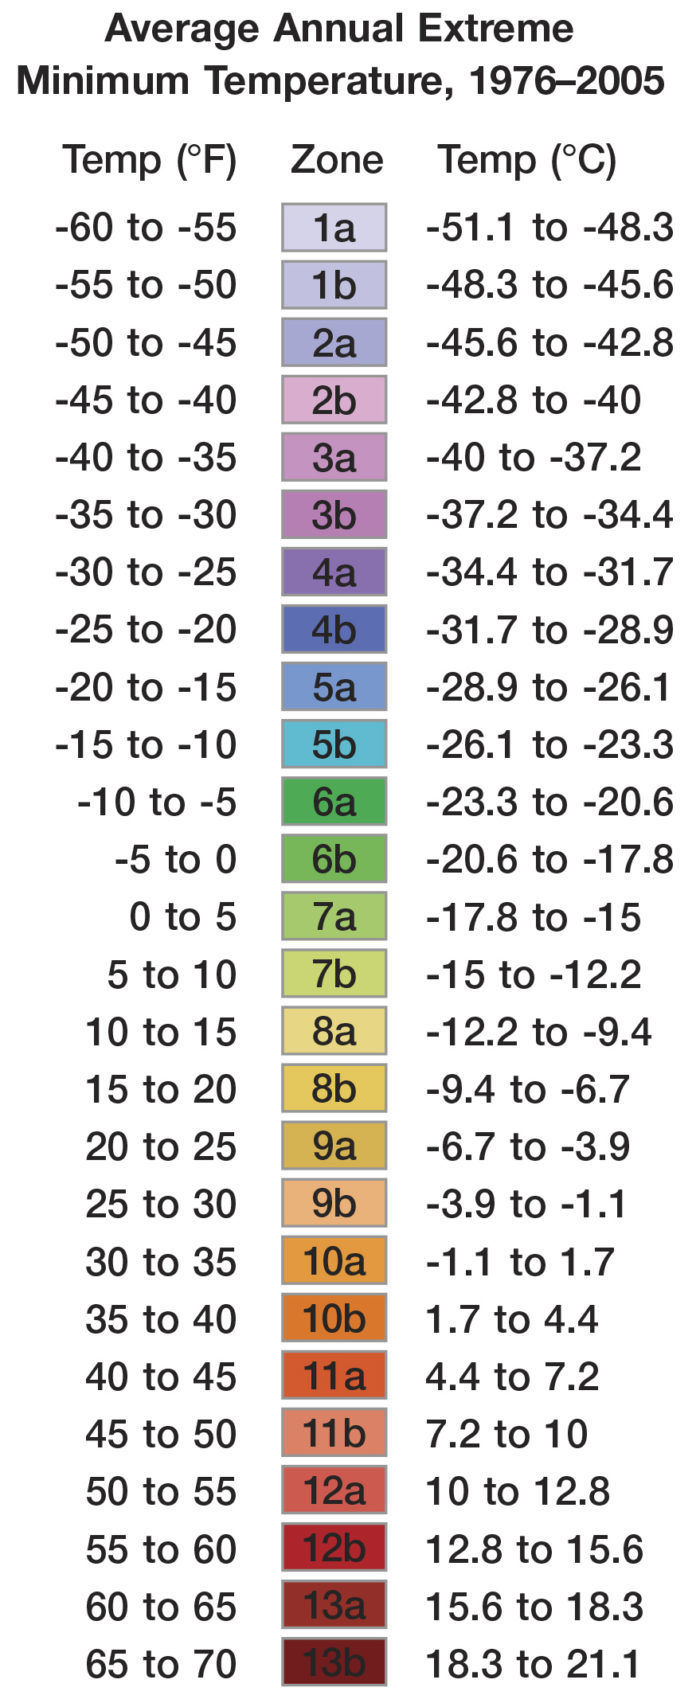 The map was updated in 1990 to include Canada and Mexico and to account for changes in weather patterns. Since then, technology has progressed in leaps and bounds, and scientists’ abilities to measure weather more precisely have followed suit. Starting this spring, a brand new map is in play, which takes advantage of everything our current technology has to offer. For many plant geeks, this is the most exciting thing to happen in the gardening world in years.
Kim Kaplan, spokesperson for the ARS (Agricultural Research Service, the in-house research arm of the USDA), believes that the most important thing about the new map is that new technology has made a huge difference in the ability of the ARS to make this map as accurate as possible. If your zone has changed, therefore, don’t automatically assume it’s because of global warming. So many factors went into creating the new map that any number of things could have moved the boundary of your previous zone. Just remember that if a plant is thriving in your garden now, a zone change isn’t going to change that.
Got Zone Envy?
If you wish you could grow some plants that are beyond your zone, try creating nanoclimates in your garden:
Planting against a stone wall will take advantage of the warmth the wall absorbs from the sun.
Installing a wind break prevents plants from being desiccated by winter winds.
Adding a thick layer of mulch insulates the roots of tender plants.
Remember, a plant’s hardiness zone is just one of the many things that determine whether a plant will thrive in your garden. Sunlight levels, soil type, and typical snow cover all make a difference in a plant’s overall health.
Here are Some of the New Features of the Latest Map:
Two new zones
In the past, Zone 11 encompassed any climate where the lowest winter temperature was above 40°F. Zones 12 and 13 expand upon that zone to classify tropical plants more accurately.
Digitally interactive
The new online map allows you to zero in on your area even more closely to pinpoint your exact zone.
More inclusive and historical
While the last version of the map relied on 13 years of data, the new version encompasses more than 30 years of data collected from more weather stations and locations.
Enhanced data
New algorithms fill in the gaps of areas between weather stations and take into consideration factors like proximity to large bodies of water, elevation changes, prevailing winds, and slope of the land, giving each factor an appropriate weight when determining zones for these gray areas.
Ground tested
Mapmakers called on climatological and horticultural experts across the continent to verify new zone findings in specific locations, making adjustments accordingly.
Michelle Gervais is an associate editor who refers to the zone map every single day.
Map: courtesy of the Agricultural Research Service, USDA






Comments
Log in or create an account to post a comment.
Sign up Log in